I’m quickly approaching 500 posts. Instead of creating new and different posts I’d thought I’d recycle some posts leading up to the 500th post. (Hey! TV shows do it all the time.)
Here’s an older post showing how to have one vertical curve for both sag and crest. Unfortunately as posted originally it didn’t account for profile views that went from left to right. In order to fix it change the instances of Midpoint of the Dimension Line to <Feature>, Anchor PVI Dimension. Do this for all instances of the label components such as the Curve Data, HP and LP. The labels will then show correctly when the profile view direction is changed. If you’ve been moving your template by a save as from version to version you may want to go in and update the styles to utilize the additional <Feature> Anchor Point options which have been added. Especially if you have multiple vertical and curve styles to show the same information. The new anchor points provide the ability to remove some of the excess styles.
To have one style for sag and crest vertical curves with and without high and low points. So you can just have on main label style for sag and crests.
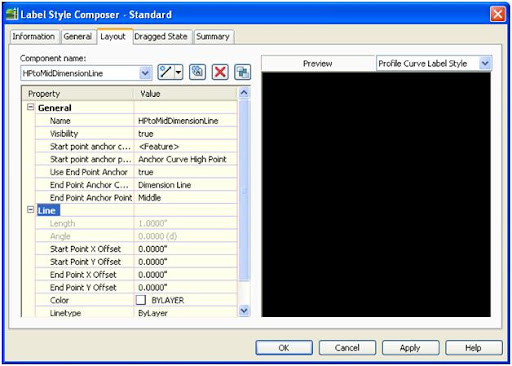
- Add a line to the label. Set the Start point anchor component to the Anchor Curve High Point and the End Point Anchor to the Midpoint of the Dimension Line. Give the line a name so you can remember what it does.
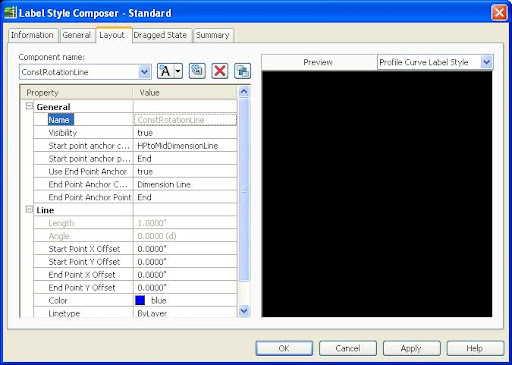
- Next create a line construction line which will be hidden in the style, but will help rotate the text parallel to the dimension line. It is needed because we have to tie to the previous line created and have a way to make it look like the other text in the label. If you skip this line then it will be nearly impossible to get the rotation right as the label is moved up and down.
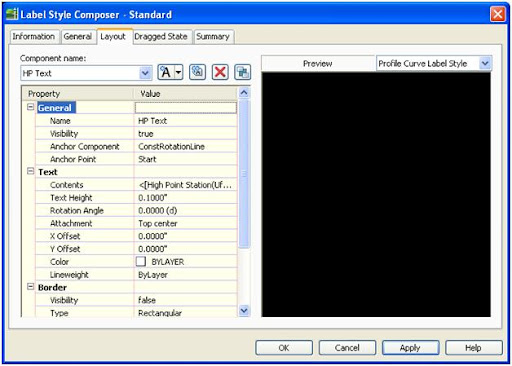
- Next add the text to the label for the HP. Use the anchor point of the start of the construction line you created in the last step. Add whatever text you require for the HP.
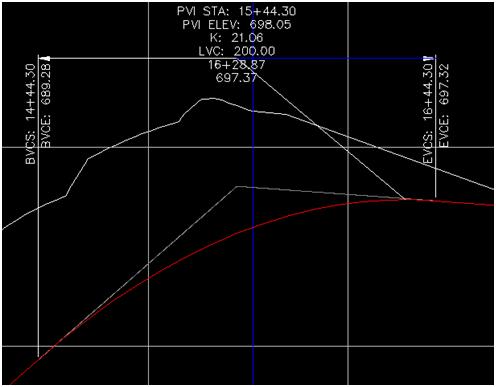
- Here is a picture of how the label looks.
- Just change the visibility of the HPtoMidDimensionLine and the ConstRotationLine to false so it not seen in the final style.
- Repeat the steps for the low point, using different names for the components.
- Since the low point and high point portions of the label are anchored to the low or high point the those portions of the label won't show if there isn't a high or low point of the curve.
I have also uploaded the HP portion of the label here.
Here’s an updated example (Civil 3D 2010) based on James’ file in a post on Civil3D.com.


The only problem with this approach is if the highpoint of the curve isn't in the current profile view. The only way I know of to get the highpoint (or lowpoint) text in this situation is to use an expression to test if the highpoint is at the beginning or end of the curve. If it is, make the highpoint text small. If it isn't, make the highpoint text normal.
ReplyDelete